
Agile Metrics From Lean Kanban
Table of Contents
Story Lead Time
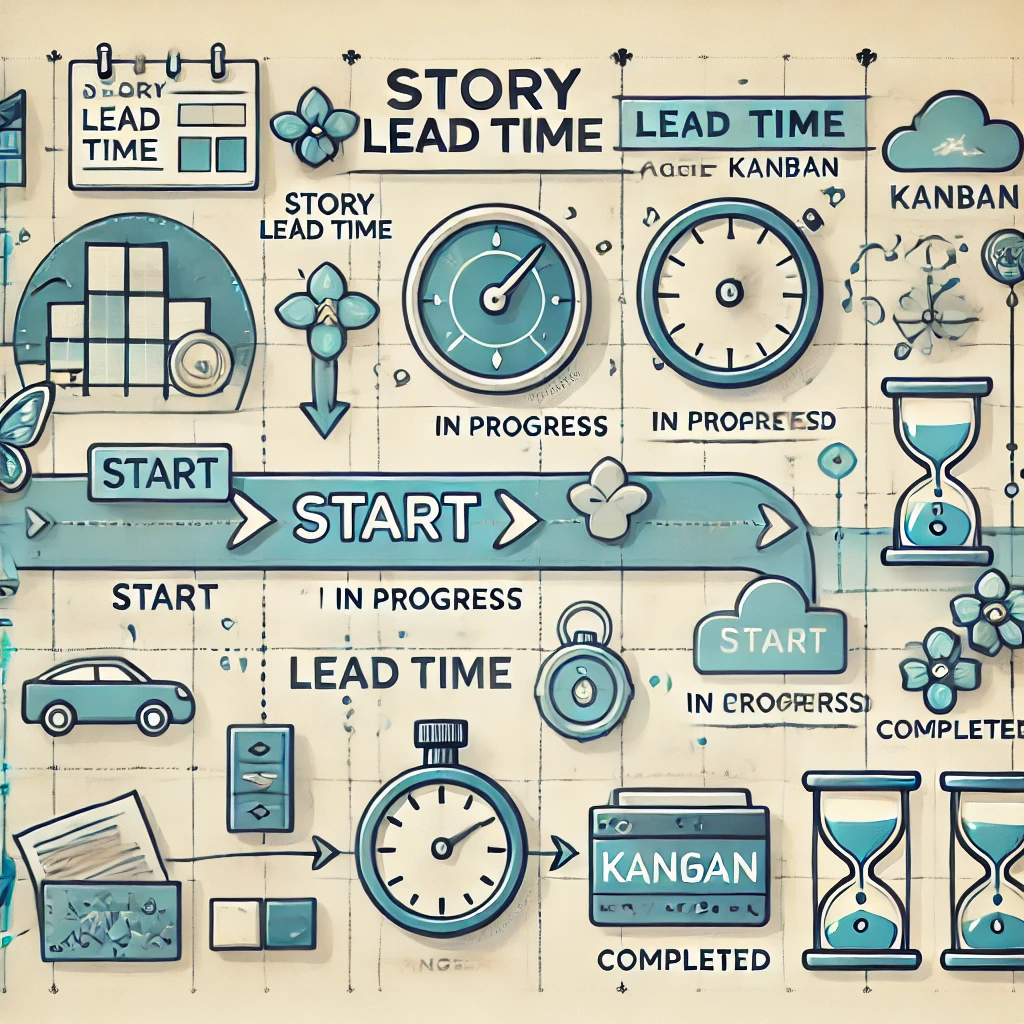
Lead time is a concept that is often used in Lean and Kanban methodologies. It is the total time elapsed from when a user story is entered into the system (e.g. written to the backlog or created in a project management tool) until it is completed, i.e. becomes ‘done’. This includes the time spent in the backlog. So the history runtime tells you how long it takes for a request or enhancement to fully pass through the system. You may want to change the criteria for when a story is ‘Ready’ to signify that it is actually released to customers rather than ready to be released. When calculating velocity, you’re using your usual definition of ‘ready’ (which matches your definition of ‘Ready to Deliver’ rather than actually released to the customer) because you’re trying to figure out how quickly your team can close out one story completely and move on to the next. Lead time is a measurement of the total time it takes to execute from first creation to realisation (when it starts to deliver value). Execution time is useful for determining the overall velocity of your value chain. You should try to reduce your story execution time (in many ways it is a much more important metric than velocity).
Make sure you use the total elapsed time. Even if it includes long waiting periods. If a story goes into the backlog for six months and is then produced and delivered within a month, the lead time is seven months! If you’re thinking, “But that’s going to force us to move stories through the backlog and into production quickly, isn’t it?” then you’re beginning to understand the importance of story turnaround time.
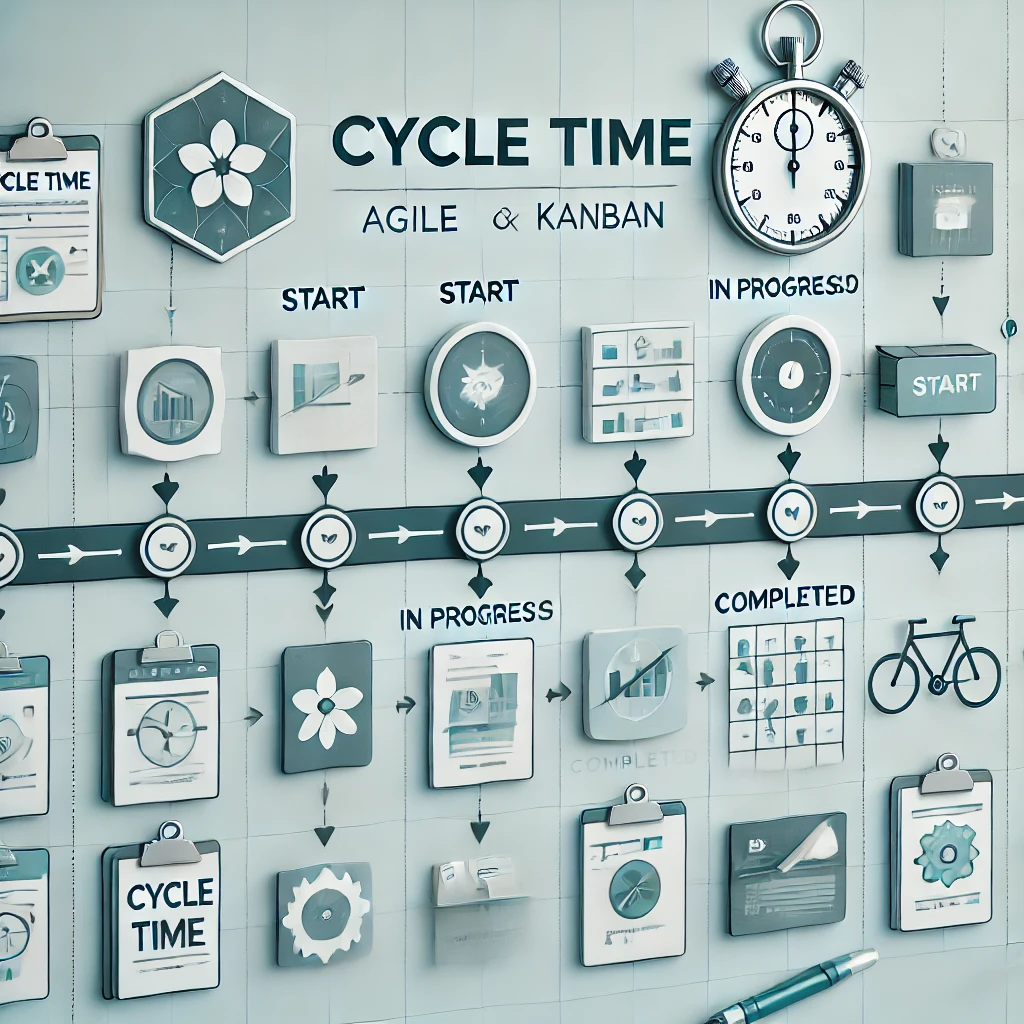
Story Cycle Time
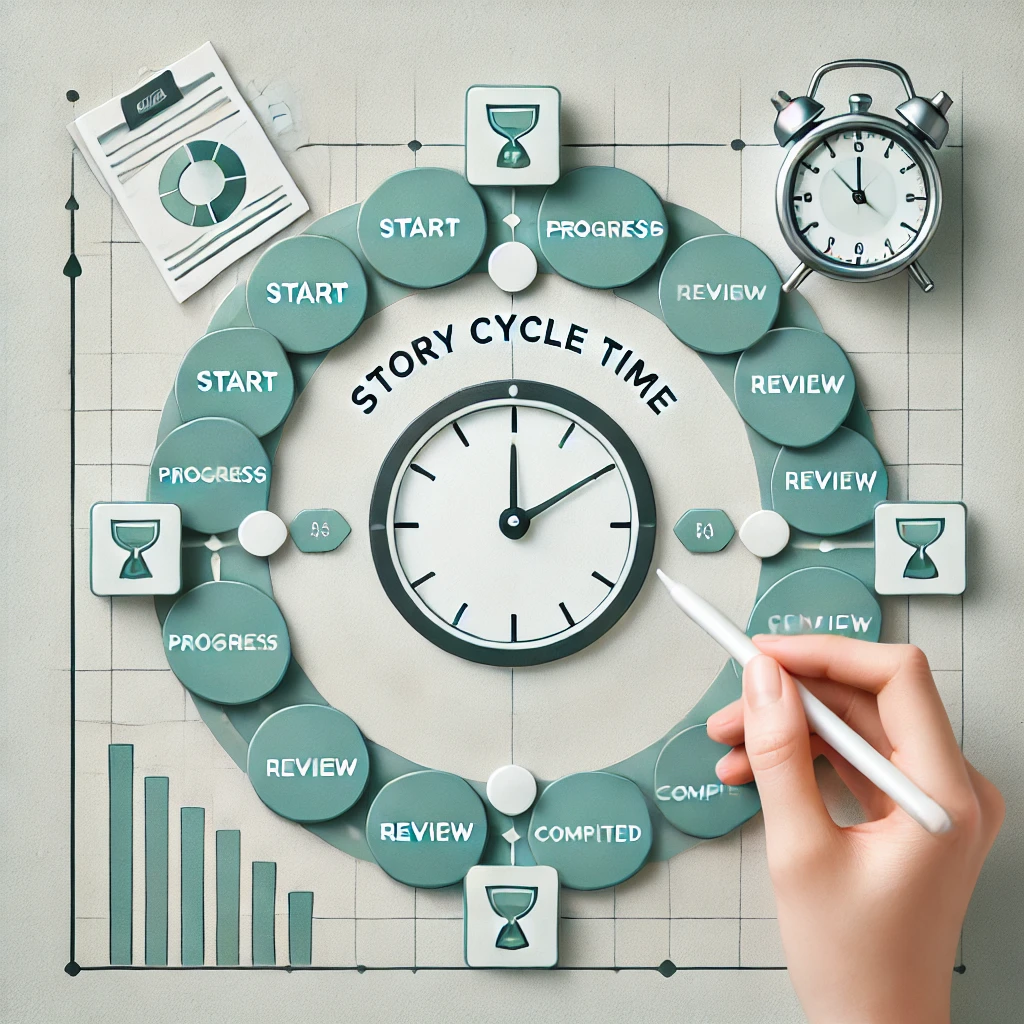
The Story Cycle Time is similar to the Run Time, but with one important difference. It is the time it takes for a story to go from ‘In Development’ (you probably have this or a similar status in your project tracking tool) to ‘Done’. So - it is a subset of the story’s cycle time, and therefore always less than it. Cycle time is lead time: the time a story or requirement spends in the queue waiting for actions to be performed. As with story execution time, you should try to keep it as low as possible. Ideally, your average cycle time should be half or less of the sprint time. If your average cycle time is more than the time of a single sprint, you have a big problem because you are not completing stories in a single sprint. As with cycle time, make sure you’re using the total time since a user story entered development, even if it’s blocked, stuck or long out of development. If the story moves between states (for example, between ‘In Development’ and ‘In Testing’), make sure you include that time as well. The clock never restarts; it starts running when the story first goes into development, and stops when it’s finished. No exceptions.
Feature Lead Time
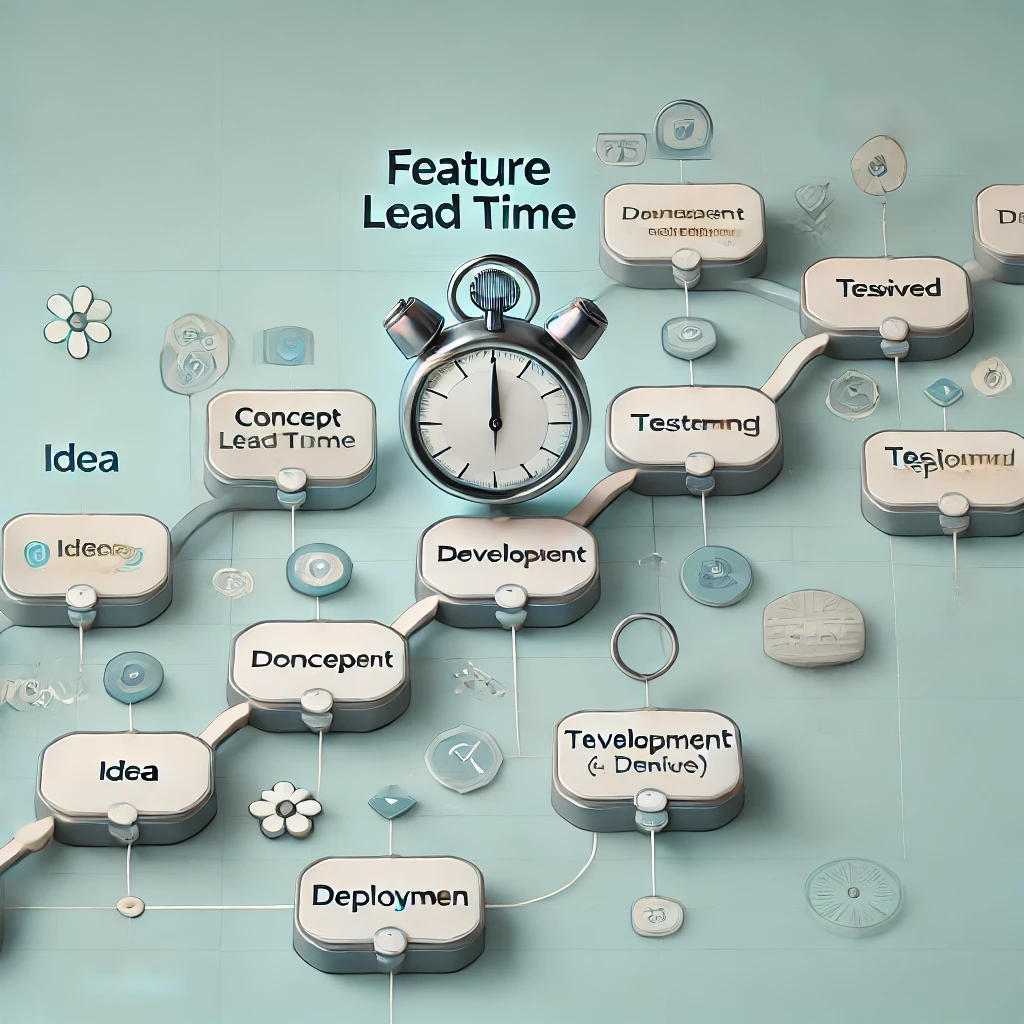
Feature Lead Time is similar to the Story Lead Time, but only for the feature, not the story. Since user stories are often aggregated and released as a feature, this is actually a very useful metric. It describes how long it takes for valuable work to go from idea to customer implementation. As with user stories, the clock for a feature starts counting down the moment it hits the backlog. If you want to measure the concept to cash metric, i.e. how long it takes to get a release to users, the clock stops when the feature is delivered to users. If you want to measure the time it takes for a feature to be ready for delivery, the clock stops when the feature is ready for release (where the feature may actually be deployed but inactive or disabled).
Feature Cycle Time
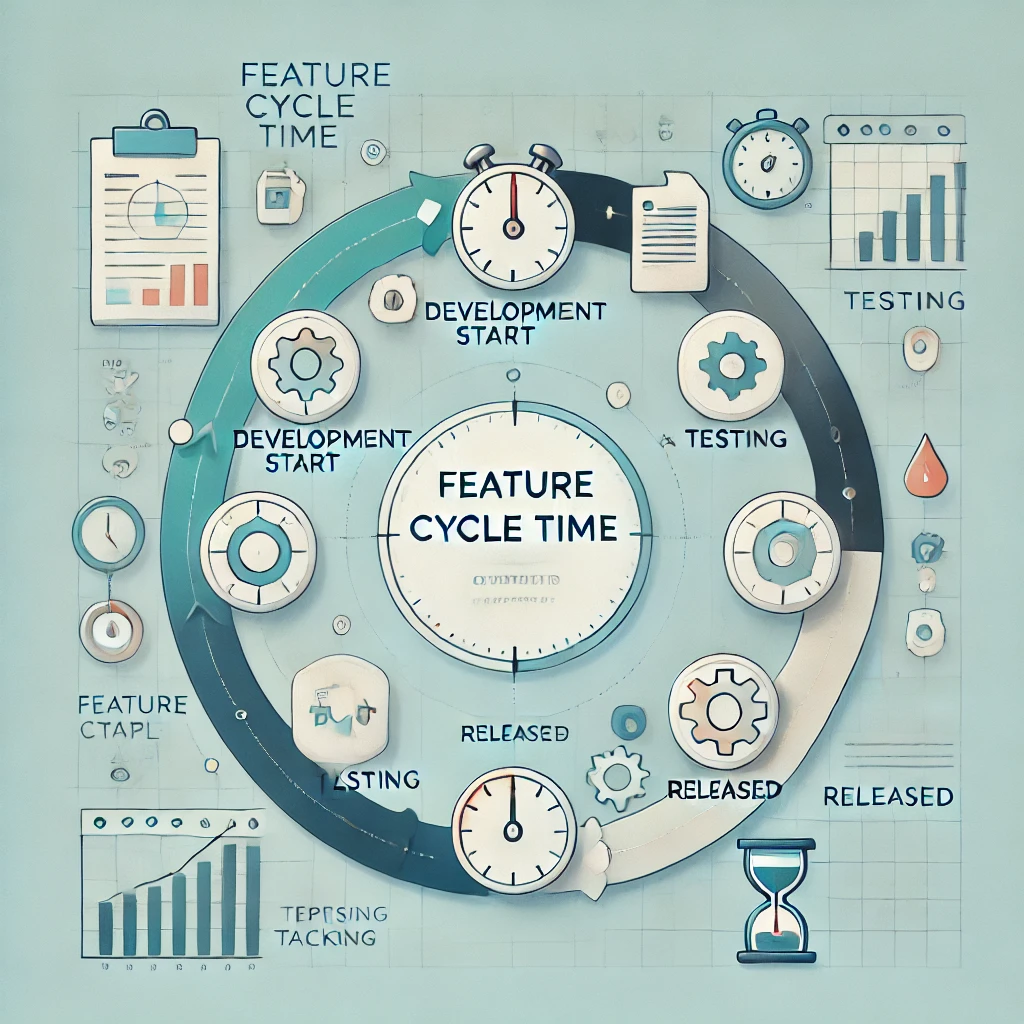
Similar to the previous metric, feature cycle time is similar to history cycle time, but for features rather than stories. It describes how long it takes, on average, to create a feature. As with the previous three metrics, you want this metric to trend downwards. Breaking up stories and features into smaller chunks will help with this (and it’s good practice). Be sure to include total elapsed time, including wait time and service handoff time. The measurement is similar to the runtime of a feature, but the countdown starts when the feature goes into development. You should define this to occur when the first user story or task that is part of the feature enters development.
Story Throughput
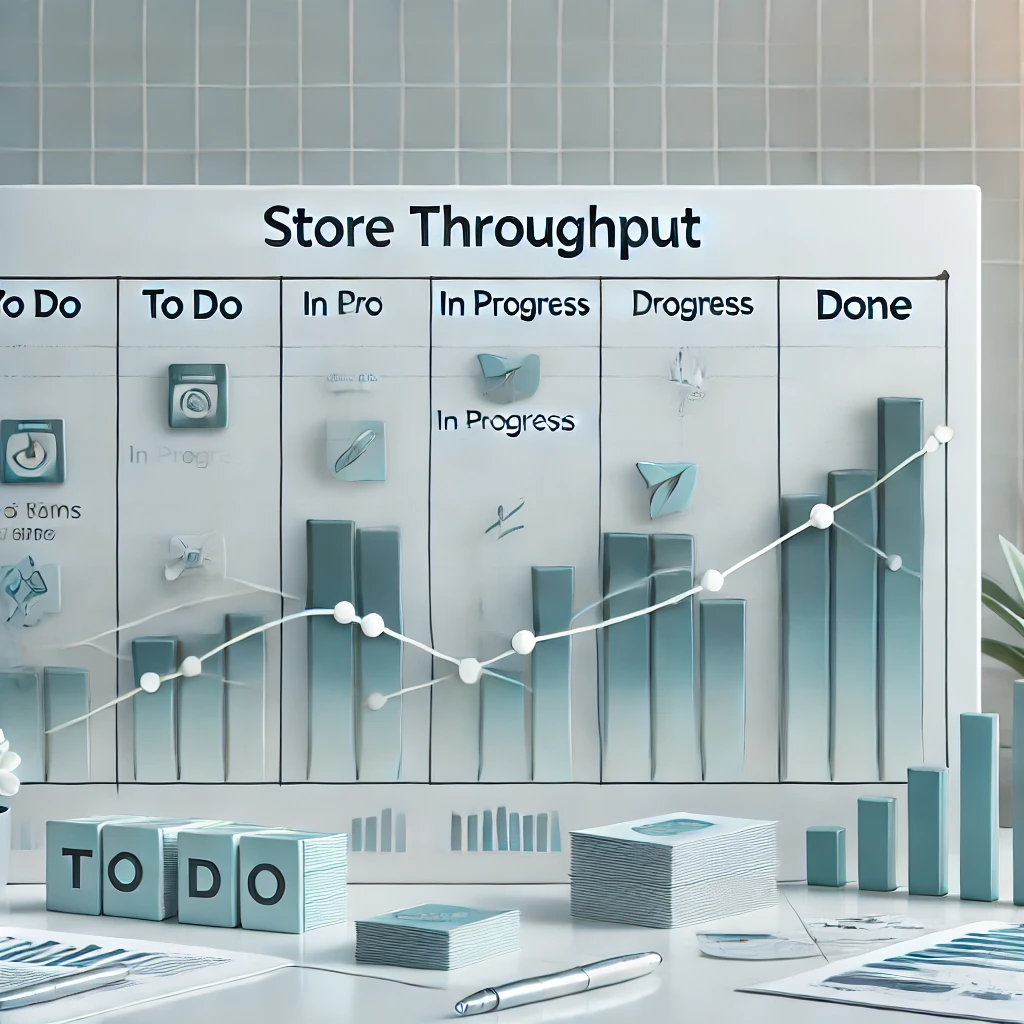
This is a great underrated metric. I think it is generally more useful than speed for a number of reasons. It’s extremely easy to measure, hard to beat, reveals important details, encourages breaking down into smaller stories, and is an important part of moving away from scoring. It’s also very simple: it’s the number of stories completed in each sprint. As with speed, only stories that meet your definition of readiness are counted, and they are counted only for the sprint in which they were completed, not the sprint in which they were started.
How to use this metric
Story throughput tells you how many stories you complete, but it also tells you how many of them you complete. Here’s an important point: if your stories are all the same size, you can dispense with speed and use story throughput. Here’s another important point: if your stories follow a normal distribution (that is, most of them have about the same average size), then you can use story throughput to plot your burn-in chart. So you can use throughput even if your stories are not all the same size. But to do this they must have a mean and a normal distribution, which you should have. You can use a long term average or a shorter term average (like a moving average over three sprints) to base your story throughput on.
Cycle Time
Cycle time is an unusual metric, more suited to lean manufacturing than lean software development. But some people discuss its use because it is an important part of the Lean methodology, so it is worth explaining what it is. Takt time is the average time between customer orders. So if you get 48 customer orders per day, your takt time is 30 minutes (there are 24 hours in a day, so we get 2 orders per hour). Takt time is a measure of customer demand, so it is the primary metric used to manage productivity in lean manufacturing systems (because the system is based on pulling, not pushing). Customer orders are not really ‘output’ in the context of software, as software can be copied at almost no cost (or delivered as an internet service at almost no cost), so this metric is not as useful in the context of software.
Created to Finished Ratio
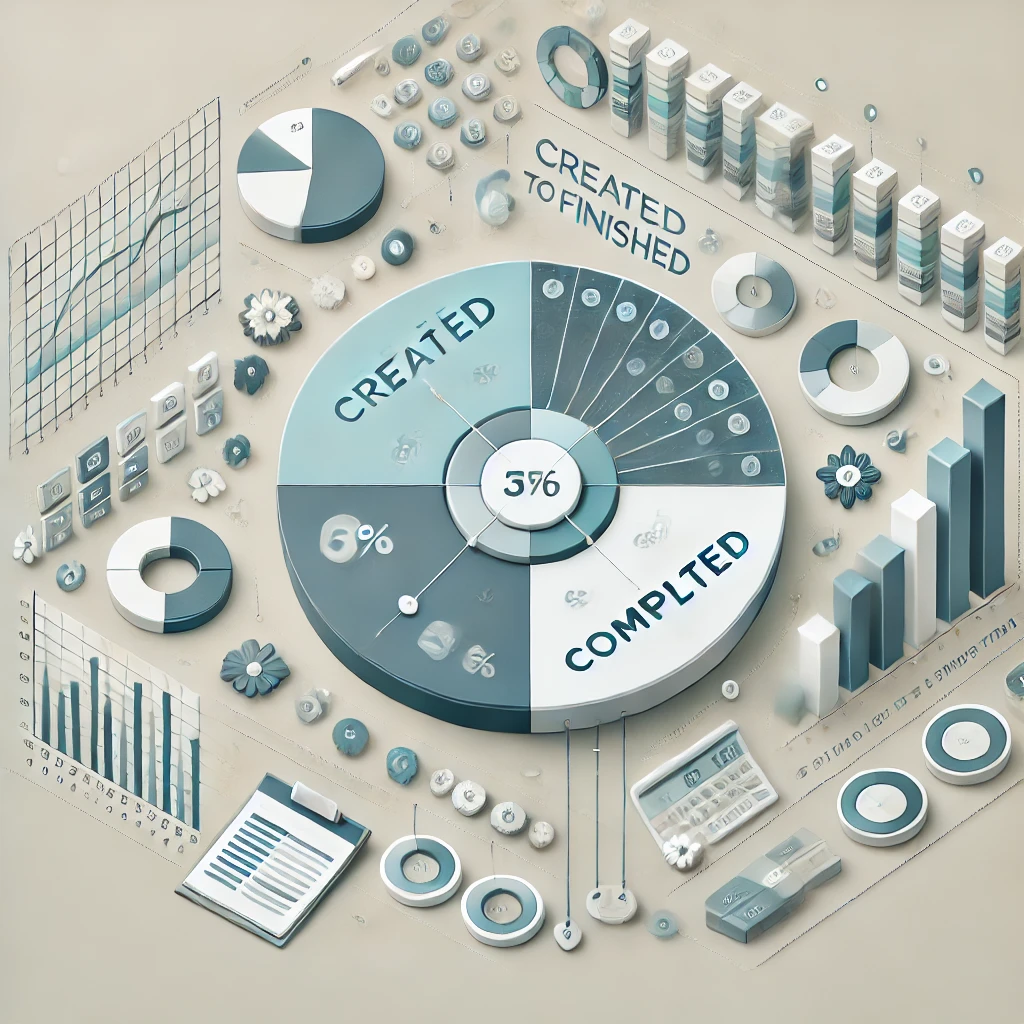
This metric is interesting because it shows the ratio of stories created to stories completed. Each sprint takes the number of stories created (regardless of where or what state you have them in) and divides it by the number of stories completed (according to your definition of done). In the early stages of product development, this number is likely to be greater than one. This is because people are coming up with new ideas and writing stories, and the developers are slowly progressing the stories, building the architecture, coordinating the model design, etc. (although they should still be releasing reasonably usable software during each sprint). However, this should slow down over time. Of course, if you really want to work on the backlog, this number should be less than one. A good motto to remember here is “stop starting, start finishing”.
How to use this metric
Use this indicator if you are concerned about a large number of items in the backlog that are slowly decreasing. Remember that backlog is a form of inventory, and inventory is a form of loss. You want enough backlog items to keep the team busy and the roadmap high, but no more.
Posts in this series
- Agile Metrics From Business Intelligence Tools
- Agile Metrics From CI/CD
- Agile Metrics From Version Control System
- Agile Metrics From Lean Kanban
- Agile Metrics From Agile Project Tools
- Agile Metrics Principles